OECD statistics for the last half of 2010 show that there has been greater
than a 10% increase in the number of mobile broadband subscriptions in the OECD
area, exceeding half a billion in total. The total number of ‘wireless’
connections which includes satellite and fixed terrestrial mobile links was 512
million, whilst mobile broadband made up 507 million of these. Of the total
wireless connections, 65.2% were standard mobile connections whilst 33.9% were
made up of dedicated mobile data through dongles. Wireless hot-spots are not
included within this ‘wireless’ dataset.
Korea leads the race for wireless broadband subscriptions with 89.8 out of
100 inhabitants having a connection. This far exceeds the OECD average which is
41.6 with the rest of the top 5 topped out with Finland (84.8), Sweden (82.9),
Norway (79.9 and Japan (76.7). The UK clocked in at 19th with 36.9 per 100
having a wireless connection. The OECD put down the growth in mobile broadband
to flat-rate mobile data plans, along with long contract lengths and a growth
of bundled products.
Fixed broadband subscriptions topped 300 million, but growth has slowed to
6% compared with the previous year, the lowest growth rate since data has been
collected for broadband statistics. This is largely due to market saturation
and higher broadband penetration. Back in the June 2009, the growth rate was
reported at 10%. Of fixed connections DSL is still king although with a small
drop in the total number of lines down to 57.6% (from 58%) with cable showing a
0.4% gain up to 29.4%. Fibre has gained the most, rising from 11.5% market
share to 12.3%.
In terms of penetration, the OECD has an average of 24.9 fixed broadband
subscriptions per 100 inhabitants. The Netherlands and Switzerland both top the
table with 38.1 per 100, closely followed by Denmark (37.7), Norway (34.6) and
Korea (34.0). The UK come quite well ranked at 9th of the 34 countries included
and a figure of 31.9 broadband subscriptions per 100 inhabitants, equal with
Germany.
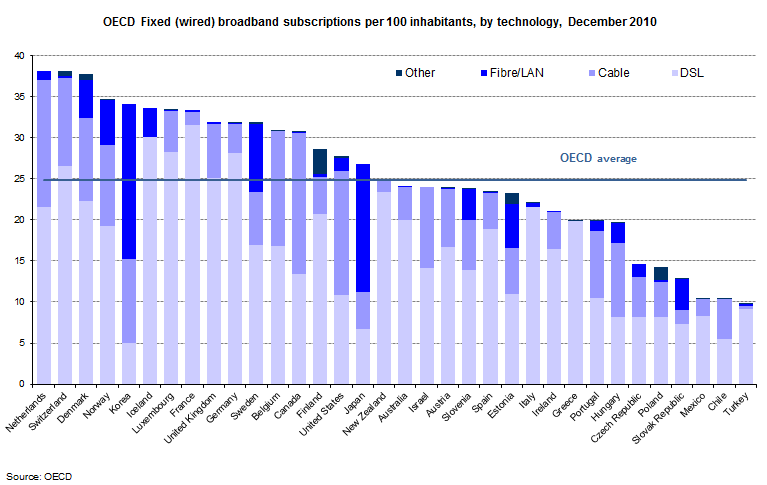
OECD fixed broadband subscriptions per 100 inhabitants, by
technology (December 2010). Click for larger image
The full data tables up to December 2010 can be found here, although not all have been updated.
 Test your broadband speed
 Follow us on X for the latest broadband news


That should have been done per household, not per inhabitant.
And what if you live in a flatshare? Or with parents?
Stupid comment.
I’d like to know why Ireland is so far down…
OECD region???? I have been an IT engineer for 5 years and never come across this acronym. The rule for acronyms SHOULD be; if its not totally obvious what it stands for, don’t use it. Thinkbroadband to be renamed simply to Broadband….?
What about the ESC area?