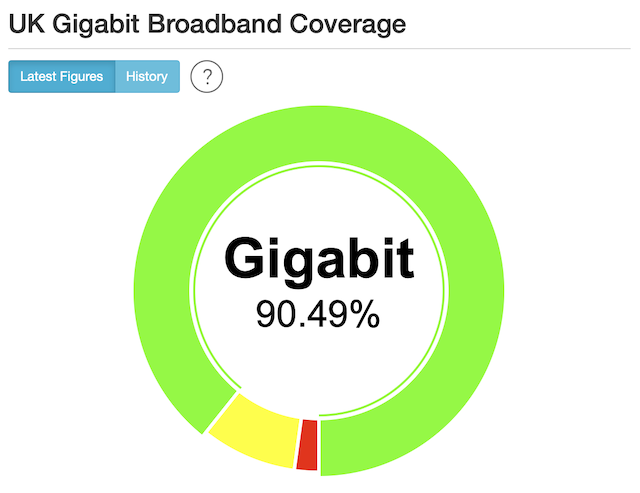
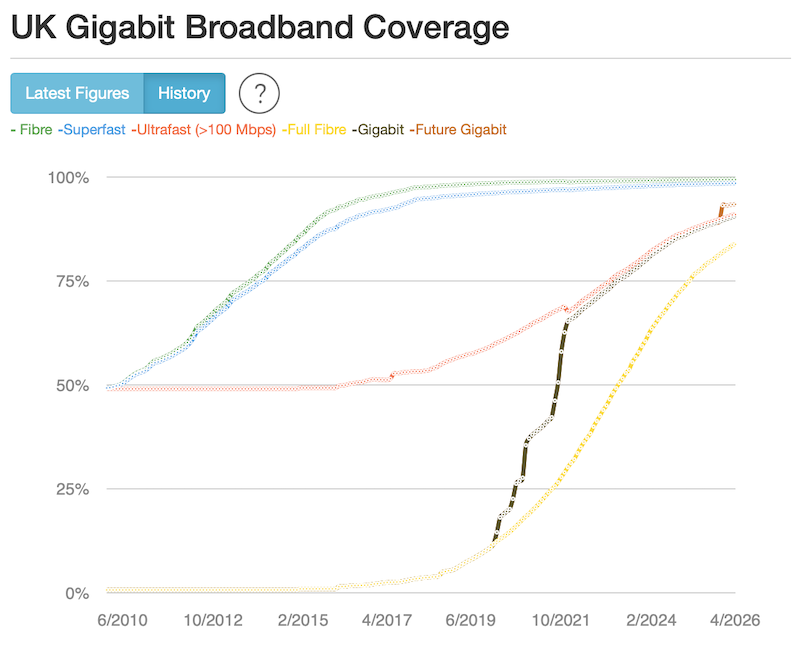
The full fibre rollouts continue and with the end of March last week and the start of a new financial year it looks like another bumper rollout month for Openreach further boosting the overall UK gigabit figures so that this stands at 90.49%.
The commercial and Government funded rollouts of full fibre (Gigabit) in Wales means that if the pace of the last month is maintained Wales will jump above the South East of England in terms of Gigabit availability.
| thinkbroadband analysis of Superfast, USC, USO and Full Fibre Broadband Coverage across the UK, its nations and regions for premises In descending order of Gigabit coverage – figures 7th April 2026 Figures in ( ) are the change since 7th March 2026 | |||||||
|---|---|---|---|---|---|---|---|
| Area | % full or part fibre i.e. VDSL2, G.fast or FTTP or; Cable | % superfast 30 Mbps or faster | % Gigabit | % Full Fibre All Providers Openreach or KCOM FTTP | % of premises with 2 or more FTTP options (inc RFOG) | % Under 2 Mbps download | % Below USO 10 Mbps down |
| Northern Ireland | 99.7% | 98.90% (+0.02) | 97.24% (+0.06) | 96.94% (+0.06) 91.35% (+0.28) | 50.32% (+0.34) | 0.3% | 0.6% (=) |
| 957,279 Premises | 954,743 | 946,710 | 930,033 | 928,033 874,517 | 481,728 | 2,852 | 5,809 |
| Yorkshire and Humber | 99.4% | 98.71% (+0.02) | 94.67%(+0.25) | 92.20% (+0.39) 77.89% (+1.47) | 56.90 (+1.23) | 0.2% | 0.5 (-0.1) |
| 2,775,290 Premises | 2,759,892 | 2,739,607 | 2,627,412 | 2,558,826 2,161,579 | 1,579,153 | 6,169 | 15,259 |
| North West | 99.6% | 98.94% (+0.02) | 94.34% (+0.35) | 91.12% (+0.67) 82.97% (+1.54) | 47.79% (+1.28) | 0.1% | 0.4% (=) |
| 3,772,900 Premises | 3,757,384 | 3,732,873 | 3,559,338 | 3,437,835 3,130,486 | 1,803,212 | 5,130 | 14,487 |
| North East | 99.3% | 98.58% (+0.04) | 93.29% (+0.36) | 83.21% (+1.18) 63.31% (+2.58) | 41.73% (+2.22) | 0.2% | 0.7% (=) |
| 1,371,922 Premises | 1,362,430 | 1,352,419 | 1,279,836 | 1,141,621 868,583 | 572,539 | 3,039 | 9,170 |
| London | 98.7% | 98.66% (-0.08) | 92.74% (-0.13) | 80.39% (+0.73) 57.01% (+1.76) | 39.46% (+0.67) | <0.1% | 0.2% (+0.1) |
| 4,143,631 Premises | 4,091,523 | 4,088,008 | 3,842,930 | 3,330,916 2,362,410 | 1,635,117 | 234 | 6,731 |
| West Midlands | 99.5% | 98.96% (+0.01) | 92.58% (+0.29) | 85.13% (+0.78) 70.92% (+1.73) | 42.73% (+1.18) | 0.1% | 0.3% (=) |
| 2,851,499 Premises | 2,837,747 | 2,821,749 | 2,639,779 | 2,427,381 2,022,415 | 1,218,356 | 2,546 | 9,326 |
| East Midlands | 99.7% | 98.56% (-0.01) | 91.68% (+0.11) | 87.07% (+0.78) 68.16% (+01.77) | 39.89% (+0.51) | 0.3% | 0.7% (=) |
| 2,401,386 Premises | 2,394,401 | 2,366,835 | 2,201,569 | 2,090,815 1,636,869 | 958,027 | 6,968 | 16,410 |
| England | 99.4% | 98.62% (=) | 90.96% (+0.26) | 83.99% (+0.82) 66.46% (+1.72) (includes KCom Lightstream) | 39.92% (+1.10) | 0.2% | 0.5% (=) |
| 27,785,303 Premises | 27,623,279 | 27,401,813 | 25,274,197 | 23,335,781 18,464,874 | 11,092,933 | 41,026 | 131,474 |
| United Kingdom | 99.4% | 98.50% (+0.01) | 90.49% (+0.32) | 83.82% (+0.83) 67.37% (+1.63) (includes KCom Lightstream) | 38.69% (+1.04) | 0.2% | 0.6% (=) |
| 33,315,079 Premises | 33,111,801 | 32,815,306 | 30,147,648 | 27,923,642 22,445,225 | 12,889,394 | 65,985 | 198,185 |
| Great Britain | 99.4% | 98.49% (+0.01) | 90.29% (+0.33) | 83.43% (+0.85) 66.66% (+1.67)(includes KCom Lightstream) | 38.35% (+1.07) | 0.2% | 0.6% (=) |
| 32,357,800 Premises | 32,157,058 | 31,868,596 | 29,216,810 | 26,995,609 21,570,708 | 12,407,666 | 63,133 | 192,376 |
| East of England | 99.6% | 98.72% (+0.01) | 88.96% (+0.36) | 81.09% (+0.96) 64.34% (+1.57) | 35.01% (+0.83) | 0.1% | 0.5% (=) |
| 3,073,561 Premises | 3,062,325 | 3,034,299 | 2,734,114 | 2,492,450 1,977,574 | 1,076,066 | 4,420 | 14,453 |
| South East | 99.6% | 98.40% (+0.01) | 87.80% (+0.37) | 79.52% (+0.95) 58.40% (+1.89) | 33.64% (+1.33) | 0.1% | 0.5% (=) |
| 4,456,014 Premises | 4,437,620 | 4,384,589 | 3,912,349 | 3,543,642 2,602,217 | 1,498,874 | 6,280 | 23,441 |
| Wales | 99.2% | 97.88% (+0.05) | 87.71% (+1.13) | 85.67% (+1.23) 80.73% (+1.86) | 26.90% (+1.02) | 0.4% | 1.3% (=) |
| 1,641,493 Premises | 1,629,175 | 1,606,711 | 1,439,694 | 1,406,341 1,325,170 | 441,501 | 6,523 | 20,689 |
| Scotland | 99.10% | 97.58% (+0.07) | 85.39% (+0.53) | 76.88% (+0.94) 60.75% (+1.15) | 29.79% (+0.64) | 0.5% | 1.4% (=) |
| 2,931,004 Premises | 2,904,604 | 2,860,072 | 2,502,919 | 2,253,487 1,780,664 | 873,232 | 15,584 | 40,213 |
| South West | 99.3% | 98.04% (+0.03) | 84.27% (+0.55) | 78.67% (+0.97) 57.93% (+1.27) | 25.57% (+0.77) | 0.2% | 0.8% (=) |
| 2,939,100 Premises | 2,919,957 | 2,881,434 | 2,476,870 | 2,312,295 1,702,741 | 751,589 | 6,240 | 22,197 |
Not everything is plain sailing and this is most clearly shown in London where the superfast broadband and Gigabit availability figures took a dip for a second month in a row. This is a combination of factors such as checks on the Openreach and altnet FTTP footprints across London, plus the older VMO2 DOCSIS footprint, plus new build flats that don’t seem to have good broadband available yet. A big factor is large blocks of student accommodation with superfast advertised as part of the monthly rent but no solid indication of the speeds or how it is delivered. We have been similar checks across other regions of the UK.
 Test your broadband speed
 Follow us on X for the latest broadband news




Leave a reply