Many long time users will be aware of our Broadband Quality Monitor (BQM) tool which we have been offering for many years, to allow users to track the performance of their broadband connections. This works by ‘pinging’ your broadband router once a second, and logging the response time (latency) of the result, and every 100 seconds, plotting these on a graph showing the minimum, average and maximum latency, as well as percentage of packet-loss. This means you can track even a one-second outage with your broadband connection.
This tool only works if you have access to enable responses to ICMP Echo Requests (often known as ‘WAN Ping’) which may require advanced settings in your firewall. It’s not a tool for everyone, and not every router supports it, but it can be very helpful in diagnosing service issues, especially when it comes to having evidence for providers. Understanding the results is important as not all spikes are problems. We have a lot of examples of what graphs with problems look like.
A few years ago, we introduced a feature to enable you to use a hostname instead of an IP address when monitoring, specifically so that those with dybamic IP addresses could use the tool. This is quite popular but does mean we need to do a lookup every 60 seconds (this is usually the ‘time-to-live’ or TTL on a Dynamic DNS record and denotes how long the IP address is considered valid for before re-querying). This works great in most cases, however we’ve had reports of problems with duckdns.org addresses. When we tested this, we found the response times for duckdns.org hosts was always over 100ms (milliseconds), and sometimes several seconds, whilst the popular DynDNS.org service was responding in under 6ms. The long response times (over a second especially) may mean the query times our in our system. Some of our tests looked like this (based on real hostnames in the BQM tool used by our users):
Hostname: xxx.duckdns.org, IP: x.x.x.x, TTL: 60, Response Time: 110.209 ms
Hostname: xxx.duckdns.org, IP: x.x.x.x, TTL: 60, Response Time: 4343.93 ms
Hostname: xxx.duckdns.org, IP: x.x.x.x, TTL: 60, Response Time: 104.989 ms
Hostname: xxx.duckdns.org, IP: x.x.x.x, TTL: 60, Response Time: 903.929 ms
Hostname: xxx.duckdns.org, IP: x.x.x.x, TTL: 60, Response Time: 2735.466 ms

Hostname: xxx.dyndns.org, IP: x.x.x.x, TTL: 60, Response Time: 5.668 ms
Hostname: xxx.dyndns.org, IP: x.x.x.x, TTL: 60, Response Time: 4.866 ms
Hostname: xxx.dyndns.org, IP: x.x.x.x, TTL: 60, Response Time: 3.89 ms
Hostname: xxx.dyndns.org, IP: x.x.x.x, TTL: 60, Response Time: 4.448 ms
Hostname: xxx.dyndns.org, IP: x.x.x.x, TTL: 60, Response Time: 4.212 ms
This is what the effect of the delays on a duckdns.org hostname look like on a BQM graph:
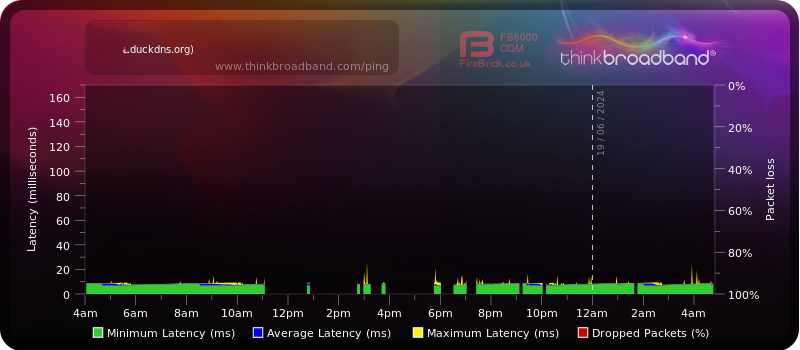
We cannot quite work out why DuckDNS is so slow. It does appear the problems match for each lookup, so it’s possible they see a lot of lookups by us (which having a 60-second TTL would cause) and they don’t have the capacity to deal with them. It is a free service hosted on Amazon Web Services (AWS) run by a couple of developers. We know DynDNS works well but it is a commercial service.
If you think we should recommend some free (and paid) providers, let us know by leaving a comment below or e-mailing us on [email protected] and we’ll look to build a list of recommended services.
 Test your broadband speed
 Follow us on X for the latest broadband news


I don’t seem to be able to get the BQM working on No-IP DDNS. Works fine on my dynamic ip until it changes, not sure where the issue is with my provider.
Yes please recommend some free and paid providers 🙂
I use DuckDNS and it’s not working with BQM for me..although it is a great free tool for other purposes.