Broadband Quality Monitor FAQ
We partnered with Firebrick to host a FB6000 device which registered users can subscribe to, and see a live and historical graph showing the performance of their line with regards to ping times.
Our BQM service is quite a technical tool and you need to understand how to interpret its results. Also, please be aware that not all broadband routers support BQM. Please see our list of supported/unsupported routers at the end of this page.
How does the Broadband Quality Monitoring work?
Once you have registered an IP address for monitoring, we will ping that IP address sending small ICMP echo requests. We send a ping each and every second and average 100 seconds of pings for each point displayed on the graph.
Small ICMP Packets — Each ping is very small at only 28 bytes in size (20 byte IP header and 8 byte ICMP), so the average usage per month should be around 73.64 MB (MegaBytes). These small packets with minimal payload may not work with some routers. You can test this on a Mac/Linux command line shell using “ping -s 0 x.x.x.x” (where x.x.x.x is the IP address you’re pinging). On Windows this is “ping -l 0 x.x.x.x”. A ‘standard’ ping command would result in a 64-byte packet.
Do you support Dynamic IP addresses or hostnames?
Yes! As of May 2017, we now support hostnames as well as static IP addresses, so if you use a Dynamic DNS service then you can provide us with your hostname and we will update the IP address when it changes.
You still need to subscribe to a dynamic DNS service (or your provider may update DNS based on your IP); be aware that it may take us a bit of time to detect IP changes, and currently these are not shown on the graphs so you may find this explains some odd patterns.
IMPORTANT NOTE: Please pay particular attention to how your dynamic DNS hostname is updated; if it’s software running on your laptop and you go to a public wi-fi, it may update the address to that one and not be what you intend to monitor. Also note that a hostname can point to an IPv4 and/or an IPv6 address. If you have both (also known as dual-stack) we will ping the IPv6 address by default. You can always set up IP-based monitors as well to see. This often catches users of Dynamic DNS services out.
My IP address starts 10.x.x.x, 192.168.x.x can I monitor it?
These are local IP addresses that are used locally on your network. We would only be able to monitor as far as your broadband router. To find out what the IP address of this is, please use our What is my IP page.
The system tells me that the IP address is already being monitored?
We limit the system to only allow three users to monitor the same IP address. Sometimes users may be monitoring their ISP’s router or web server IP addresses and this limit is in place to prevent our BQM service from being abused as a denial-of-service attack tool.
How many monitors can I add?
We allow each user to setup up five separate monitors (an IPv4 and IPv6 monitor for the same connection would count as two monitors); if you have a legitimate reason to want more, please contact us and we may be able to increase your account limit.
Can I monitor IP addresses of overseas connections or web servers?
We do not restrict you to monitoring UK broadband connections, although our monitoring is based in London and designed for this purpose; you can use it to monitor any IP addresses which you control or have permission to monitor. Please do not add IPs which do not relate to your services, without permission from the relevant system administrator.
Will you still monitor if I turn my computer off?
We can only monitor devices that are connected to the Internet and powered on. If you use a broadband router which is separate from your computer, and remains turned on when you turn your computer off, we should be able to monitor this. However if you turn off your router, or you turn off your computer which uses a broadband modem rather than router, we would not be able to monitor it, and it should show up as 100% packet loss.
Will this use up my usage allowance?
We only send very small ping packets every second. These are 28 bytes in size, so the total usage from our system would be 2.42MB (megabytes) per day, or on average around 73.63MB (megabytes) per month. Most broadband packages with usage allowances would measure them in Gigabytes (1000MB), so this would represent an insignificant amount in your usage allowance. If in doubt, please contact your service provider.
You are pinging my server/router and I haven’t asked you to – can you stop?
Sure, please contact us with the relevant details and we’ll do this. We do not add IP addresses unless requested to do so by a user, so it’s likely this is either an old IP of another user, a mistake or you run a very popular web service which someone has added without permission.
I have registered my IP address but nothing is showing on my graph?
If your graph is blank and you have only just registered the IP address do remember that each line of the graph represents 100 seconds of data. So it will take a few minutes before anything is displayed.
Why is my graph all red / show 100% packetloss?
If your graph is solid red like this example:

BQM graph with ICMP blocked
Then double check that your registered IP address is correct, and that your broadband router that has been assigned this IP address. Check the router is configured to respond to ping requests on its WAN/Internet port. The option is sometimes referred to as ‘reply to ICMP requests’.
We maintain a list of some routers with guides on how to configure them to work with the Broadband Quality Monitor in our Router Configuration Guides.
Our traceroute tool at www.thinkbroadband.com/tools/traceroute is an easy way of checking whether your router is responding, rather than waiting for the graph to update.
The latest version of the Virgin Media Superhub firmware (R36) hides the setting under Advanced settings > Tools > Ping – ‘WAN Ping Respond’, ‘Respond to ICMP echo requests sent to WAN IP’
Some devices (we’ve had reports of Synology NAS units but we know it affects a wide variety of routers too) may have a ‘Denial of Service’ (or DoS) setting that protects you from unwanted traffic and may block pings, or repeated pings. You may need to put in an exception for our IP ranges (see below).
CGNAT — You could also be on a ‘Carrier Grade NAT’ (CGNAT) service which means you’re sharing your public IP with other users. If this is the case, you will not be able to use the BQM tool at least using an IPv4 address. Unfortunately due to IPv4 address space shortages, more and more providers are using CGNAT. You could use IPv6 if your router and ISP supports it; routing for IPv6 can vary.
Watch out with IPv6 — If you’re monitoring an IPv6 address make sure it’s the router’s IP (ends in ::0 or ::1 usually, but not :1234 with a random number on the end. With IPv6 the IP address on our What is my IP page is likely to be the one of your computer, tablet or mobile phone, and is likely to change. It won’t be the one your router uses.
Hostnames — If you’re monitoring a hostname, make sure you check what it resolves to including IPv6; remember IPv6 will always be used first in dual-stack setup, so you may be monitoring IPv6 not IPv4.
How do I view my old BQM graphs?
On the page which displays your current BQM graph, if you click the ‘Show Previous Days’ link you can pick historial data.
This can be useful for showing to your broadband provider if there is a persistent issue that affects you at the same time each day.
Note that older data (generally over 3 months) is no longer available.
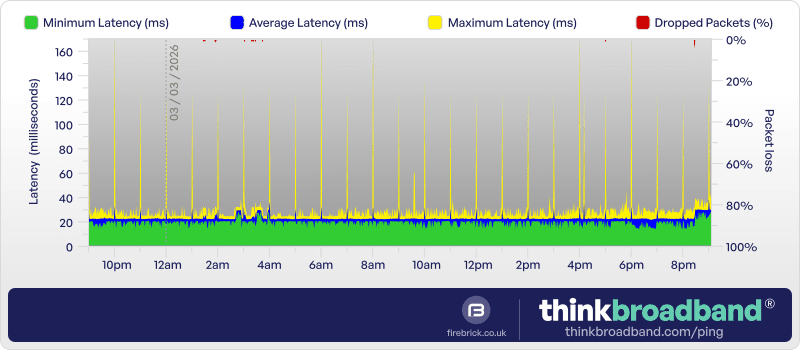
My graph has lots of very regularly spaced yellow spikes on it! What is wrong with my connection?
Some broadband routers exhibit patterns of behaviour. This is often because ICMP is handled at a lower priority than other traffic, so if a router does some form of housekeeping at regular intervals you can see patterns not unlike the graph below:

BQM graph showing router-induced tooth-comb latency pattern
This graph is from a Be/O2 connection some time ago, and is most likely using a Thomson 585 router. There is nothing wrong, and the spikes do not affect gaming. In this graph the extra yellow spikes between 3pm and midnight, probably mean the connection was actually being used.
Here’s another example of a graph with evenly spaced maximum latency increases. Average latency doesn’t change too much so it only affects a small period each hour. It’s likely to be a router performing an hourly task (causing the CPU to be busier and not respond as quickly to a ping), or possibly something on your network doing so and pushing the line to its limit for a very short period.
See below for another example (low-level packet loss) which could be caused by certain routers.
What should I see if my connection is idle and running well?
The graph below is a great example of what a nice stable broadband connection should display:

BQM graph showing a good connection
The green area is stable across the 24 hour period, which means that the line is performing well. It suggests the line has not been heavily used during this time. There is almost no blue on the graph, which tells us that in each 100 second period the latency stayed very close to the minimum which is around 16ms for this connection. The yellow (which is maximum latency) only spiked twice, at around 6:30pm and 10pm, which may represent someone opening a webpage or two at these times.
The red area of the graph, which runs along the top edge normally shows no packet loss most of the time, but there were a few packets lost at just after 7:15pm.
The BQM will usually show a red line that is one or two pixels wide stretching from the top to the bottom of the graph if a router is re-syncing.
My graph has lots of varying height yellow spikes is there a problem?
A very common type of graph is shown below:

BQM graph showing the effect of hosting (upload) and browsing (download) on latency
The graph above was from a connection, that was hosting a small webserver, and the yellow spikes represent when someone is downloading a small file or webpage from the server. The wider block of yellow spikes at 11:45am represent when the actual owner of the connection, probably started using the connection too.
The connection in this graph is good, as the amount of jitter in the latency represented by the blue area is still very small across the whole 24 hour period.
If you are on a slow connection the action of downloading or uploading lots of data can have even larger effects, e.g. a connection that is saturated by streaming two HD films at the same time will most likely show a large yellow block for the duration of the streaming.
My graph has lots of gaps?
A very common type of graph is shown below:

This is caused when we cannot map the hostname you provided to an IP address. This could be problem with your Dynamic DNS provider for example, or when your IP address changes. It may be worth asking on our Broadband Quality Monitor Forum for advice.
If you see lots of gaps with red, especially if your graph also has a lot of yellow spikes, that may mean we can’t get a response from your device rather than your router if you’re using IPv6. The IP address we detect for you may not be the router’s IP if you’re on IPv6. A router IP will end in ::0 or ::1 often, or possibly some others, but usually not a random series of letters and numbers. If you turn your device off (or even just the screen) you may find it stops responding.
How do I interpret my BQM graph?
Interpreting your BQM graph is a combination of comparing a current graph to your history, and if you are seeing unusual patterns asking other users on the same ISP or from the same part of the country if they see similar patterns. We have collated a few commonly seen examples, and annotated them with our interpretation of what the connection is doing. All these graphs are taken from the same date/time.
Packet-loss from bad sync or heavy downloading

BQM graph showing consistent packet loss, usually from bad sync or heavy constant downloading
This graph shows consistent packet loss between 2% and 15%, which would make gaming or Voice over IP (VoIP) across the connection very difficult. The minimum latency is higher than average, which suggests a permanently congested link somewhere between the broadband router and our BQM Pingbox. The fact that the blue area is still narrow suggests the packet loss is not due to the user downloading on the connection, but some issue in the core network. The tooth comb effect is most likely an artefact from the broadband router in use on the line.
It may be worth turning the router off and on again, as sometimes this can be an issue due to a bug which can be fixed through this process.
Peak time congestion

BQM graph showing peak time congestion packet loss
A classic example of peak time congestion affecting latency, and suggests the provider in question is running its links at very close to capacity. The peak time starts at 4pm and continues until midnight. On this graph it looks as if the connection was used to download/upload something around 1am and 9am, with some more intermittent usage as the morning progressed.
Re-sync

BQM graph showing a minimum latency change due to resync
This graph shows some usage in several blocks between 2pm and 10pm, but the point of interest is at 7am when the minimum latency jumps from 22ms to 40ms. There is a very narrow red spike at this time, which suggests a short resync by the router, this may have been due to noise (on an ADSL or FTTC/VDSL service), or a provider forcing interleaving onto a line to reduce the number of errors (though there is no evidence that this is needed on the line). The most likely explanation is the resync has jumped the user onto a different gateway at the ISP, which has a higher baseline latency. To ascertain what actually happened, more graphs from the same provider would need to be compared. This level of change should be less common with full fibre services which also have lower base latency, but routing changes can cause minimum latency changes.
Very busy broadband connection during night-time

BQM graph showing a very busy broadband connection
We are looking here at what is most likely a very busy broadband connection, perhaps with a combination of fast downloads and uploads happening at the same time. Saturating the upstream of a broadband connection will have a significant effect on latency. When a connection is very busy, it is not uncommon to see some packet loss, as the router will be very busy handling all the data transfers, and thus may ignore the ICMP (ping) requests occasionally.
Peak time congestion during late evening

BQM graph showing peak time congestion raising minimum latency
This graph covers a different time period to the other graphs, but shows what effect a heavily congested link from an exchange or aggregation point to the wider internet can have. In this case the minimum latency climbs from a high but OK 40ms to over 140ms at the busiest point in the evening. The consistency of the latency, i.e. wide green area with a narrow blue area helps to suggest this is not congestion from a single users line, but the effect of a much larger link becoming saturated. Anyone who is a gamer would not be able to play first-person shooters with latency like this at peak times.
Low-level packet loss
If you are seeing a lot of red dots at the top of the graph, this could be caused by your router de-prioritising ICMP echo (ping) packet responses. This doesn’t mean you’re necessarily seeing packet loss ‘through’ the router, just traffic ‘to’ the router, so you may not see any issues, but it’s worth checking this as it can also be caused by router CPU being under load. This could be made worse if there is some denial-of-service (DoS) protection feature, but can affect you even if you turn these features off. One such example is the Synology WRX560 router shown below:

Variable IPv4 vs IPv6 results – and packetloss on BQM without ‘real world’ loss
Sometimes used contact us to ask why their IPv4 vs IPv6 BQM can be very different. First ruling our DNS issues (i.e. ping a specific IP address), this can still be different as routing for v4 and v6 is a different process; in an ideal world with the same connections and settings, the route should be the same, however there’s no way to be certain that one router is the same one on v4 and v6. This can mean variations.
If you see consistent issues, please report them to us so we can look at them. Also what we have sometimes noticed is that the BQM tool reports packet-loss (3% or even 100%) whilst “real world” pings report none. This seems to be related to the fact our BQM appliance will send pings out with a very small payload, and some routers or networks seem to drop those packets, either entirely, or randomly. You can replicate this yourself on a Linux system by using “ping -c 100 -s 0 ” (or ping6 for v6).
I want to limit which devices can ping me, what is the IP address of the BQM device?
We would recommend you allow *.thinkbroadband.com if your firewall allows you to specify domain names or 80.249.99.164/28 as a subnet for IPv4. If not, you may add our IP addresses but note that these may change over time so you will need to manually update these when that happens:
IPv4 Address: 80.249.99.164 (for most users)
IPv6 Address: 2a02:68:1::164
Why does my graph have a sawtooth effect?
One unusual but common effect is shown in the sample graph below. The repeated rising edge with a sharp drop off gives rise to the waveform name of sawtooth.

BQM sawtooth pattern showing jitter affecting max latency caused by some routers
A graph of this sort appears to be common with users of the Sky LLU broadband service from years past. It does not appear to represent an actual problem with the service, or affect any applications running across the connection. This is just one of those odd situations that a particularly router appears to cause. It’s also something which can be caused by some specific routers.
Which routers support BQM?
Here is a list of routers which we have found, have been advised, or we believe are likely to (since models vary) support our BQM tool and a few we know do not:
Supported
- Virgin Media Super Hub
(Advanced Settings > Advanced > Ping > Respond to ICMP echo requests sent to WAN IP) - TP-Link
(System Tools > Manage Control > Service Configuration > enable ‘remote) - ASUS Routers
(Advanced Settings > Firewall > General > Respond Ping Request from WAN) - D-Link Routers
(including TalkTalk; under ‘Advanced Network’; may require you to create an ACL; Index 8) - Sky Hub
(under ‘Advanced’ and ‘WAN Setup’) - Belkin Routers
(Firewal Menu > WAN Ping Blocking and untick ‘Block ICMP Ping’ then Apply changes) - ZyXEL VMG1312 / VMG8924 / VMG8324
(Maintenance > Remote MGMT > IMCP protocol, enable WAN column) - DrayTek
(Systems Maintenance > Management Access Control > untick ‘Disable PING from Internet)’ - Older Thomson / Technicolor Speedtouch
(via telnet/CLI: “service system ifadd name PING_RESPONDER group wan”) - Technicolor TFG582n and most newer routers
(Advanced Options > Toolbox > Firewall > Allow PING on your WAN interface > Enable) - Netgear Routers
- Huawei HG612 / HG622
- Plusnet 582N
- Billion 8800NL R2
(Configuration > Security > Block WAN PING > Disable for IPv4 and/or IPv6 > Apply) - Cisco IOS Routers
- (..this is not a complete list so if your product is not listed below, try it out!)
Not Supported*
- BT Home Hub or Smart Hub
- PlusNet Hub Zero / Hub One (aka BT Home Hub 5a)
* These routers do not support responding to ping packets on the WAN port, however you can configure a Default or DMZ host which can respond to pings directed at your public IP address; we strongly advise you to only do this if you understand the security implications of running a publicly accessible host on the Internet.
Do you have any specific advice on how to make my router work with BQM?
The common settings you will need to look at are usually labelled “WAN Ping” or similar. It will probably say ‘ping’ but may refer to ‘icmp echo’. On some routers, you may need to disable the firewall (not something we recommend unless you know what you’re doing) or use the router in ‘modem’ mode with another router for routing. On other routers, you will not be able to use BQM at all as it has been restricted by the manufacturer (or in most cases, your broadband provider).
Specific router advice is provided below for the more common routers which support BQM.
Please note that due to the sheer volume of e-mails we receive, we cannot provide support for how to configure your router on a one-to-one basis. If you have corrections/additions to the information below, we would ask you to get in touch with the relevant details/screenshots.
If your router isn’t mentioned, please refer to our community forum for advice.
Vodafone Wi-Fi Hub
- Navigate to router web interface
- On the top tabs (Overview, Internet, Wi-Fi, etc.) select ‘Internet’
- Then on the left select ‘Firewall’
- There should be an option to enable “Allow Ping to WAN interface”; it is enabled if it shows green and the toggle is towards the right side.
Virgin Media Superhub R36 Firmware
- Navigate to router web interface
- Under the Advanced Settings -> Tools -> Ping menu
- Tick the WAN Ping Respond box
- Apply/Save changes
- BQM should soon start showing ping responses, rather than solid red
Virgin Media Superhub (Netgear VMDG480)
- Login to the router using your web browser at http://192.168.0.1 (this is the default IP address; if you have changed it, you will need to update it)
- Enter your username/password. The default settings will be found on a label at the back of the superhub under “Superhub settings” and will probably be ‘admin’ and ‘changeme’ respectively.
- On the next screen, find the ‘Advanced Settings’ link at the bottom of the page
- Under the ‘Advanced’ sub-menu click on ‘Ping’
- Finally, ensure the tickbox is checked after ‘Respond to ICMP echo requests sent to WAN IP’ and click ‘Apply’.
- That’s it! you should be done. Just don’t forget to check back regularly (we would recommend weekly) to ensure your IP address has not changed–otherwise you may be monitoring someone else’s broadband line
NetGear DGND3300 / DG834GSP / DG834N
- Login to the router using your web browser. (Type http://www.routerlogin.net, or http://www.routerlogin.com, or the router’s LAN IP address (default is 192.168.0.1) in the address field of your browser, and then press Enter).
The default username is “admin” and the default password is “password”. - Once logged in on the left you will have a menu, scroll down to the “Advanced” section and select “WAN Setup”.
- On the “WAN Setup” page locate the checkbox “Respond To Ping On Internet Port” (may also be called “Respond to Ping on Internet WAN Port”) and make sure it is ticked and press “Apply”
TalkTalk / D-Link DSL-3870
- Login to the router using your web browser. (Type http://192.168.1.1 (default is 192.168.1.1) in the address field of your browser, and then press Enter).
- You should see a TalkTalk customized page. Click the advanced button at the bottom left of the screen. You will be asked for a login, the default username is “admin” and the default password is “admin”.
- Once logged in at the top of the page you will have a set of tabs, click on “Advanced”. Then select “Network Tools” from the menu on the left.
- You may have a rule 8 which exists for ping that is set to LAN. If so, adjust the interface to Both.
- If you do not have a rule set, add a new rule with the following settings:ACL: Activate
ACL Rule Index: 8
Active: Yes
Source IP: 0.0.0.0 – 0.0.0.0
Application: Ping
Interface: BothClick the ‘Set’ button at the bottom to apply the setting
Synology RT2600ac
Under Network Centre -> Security -> Add a rule to the firewall with a “Single host” of 80.249.99.164 (for IPv4) permitting traffic.
Draytek Vigor 2926
- Select Object Setting -> IP Object and clock on a spare profile index.
- Configure the profile with settings
- Name – ThinkBroadband
- Interface – Any
- Address Type – Subnet Address
- Start IP Address – 80.249.99.164
- Subnet Mask – 255.255.255.240
- Go to System Maintenance -> Management
- Under “Internet Access Control” ensure that “Disable PING from Internet” is not checked
- Under “Access List from the Internet” check the “Apply Access List to PING” option and add the ThinkBroadband IP Object created in step 2.
 Test your broadband speed
 Follow us on X for the latest broadband news